So far in this series I've introduced you to the concept of "Badges" (what I call my free-choice activities that are designed to engage kids in how mathematical concepts are used outside of a math classroom) and we've explored one of the topics within my Badging system, activities centered around Math, Equity, and Culture. Today, we will investigate another topic strand, focused on Data Analysis and Representation.
I worry that too often in Middle Grades we focus on Algebra preparation so students are ready for the Algebra -> Trigonometry -> AP Calculus progression that we (and their college counselors...) hope to be their high school experience. I know as a Pre-Algebra teacher that I am guilty! More and more careers, however, are in need of statistical fluency and data analysis, and we do our Middle Grade students a disservice if we don't give them opportunities to think creatively with data, data displays, and statistical understandings.
This series of Badges takes a variety of topics - sports, candy, famous brand's logos, Lego, furniture, and more - and asks students to examine data displays, create their own data displays, and make inferences and hypotheses about the data sets that they are exploring.
The first opportunity I want to examine involves prime numbers. There's a Twitter feed dedicated to listing out prime numbers, in order, every hour or so. Mathematician Dr. David Butler decided to analyze which prime numbers got the most "likes" and determine if he could find any patterns or significance. He wrote about what he discovered. I asked my 7th graders to pick a favorite prime and then read through what he discovered and make predictions about why they made their choices. I also asked them to make hypotheses about "favorite" primes from other lists of primes. It has been quite remarkable to see how they engage with a pretty insular mathematics topic like primes just because of an engaging activity and data represented in an interesting way:
"Humans love repetition, and repetitive numbers are more commonly used for codes than truly random numbers"
"I think 3267000013 would be liked since the zeroes repeat"
"...when a number is close to a milestone or special number, it is also very easy to remember it, and you don’t have to think about it too much because it is close to a number that you already know. This also relates to passwords because they must be easy to remember as well, yet random, and prime numbers can be fairly random."
Students are making hypotheses and inferences based on other numbers, yet also predicting motivations for some of the choices. They're also starting to see why investigations into Prime Numbers continue today, as there's always a need for stronger codes and security. What could be a pretty provincial topic in mathematics becomes engaging for Middle Schoolers by couching it in an activity full of data analysis and their own inferences and thoughts.
Another activity that many of my students have enjoyed involves around something seemingly far less "mathy" than prime numbers and nearer and dearer to the heart of many Middle Schoolers: M & M's Candy. Quartz published the story of a statistician who wanted to discover why Mars (the parent company of M & M's) stopped publishing the data about their color ratios.
To make a short story shorter, there are now multiple factories making M & M's candy and each one has a slightly different color ratio. I asked students to read the study in Quartz, answer a few brief questions to show that they understood the basics of the study, and then eat a bag of M & M's and create a data display of the color breakdown in their bag. Could they use the colors to make a hypothesis about the origin of their bag of M & M's?
Notice how many students really started to analyze the decisions behind why certain changes were made to M & M's. Isn't that level of analysis what we want in our statisticians?
"The top three colors distributed in 1997 became the bottom three colors distributed in 2008. I think this happened because people wanted to have bolder colors in their M&M bags."
Additionally, they start to see how sample size can still make predictions about a larger population:
"I think my M&M’s came from the Tennessee factory because the percentage was higher for the ones I had more of."
They may not have formal training in sample-vs.-population discussions, but this opportunity in a "safe", candy-based setting introduces that idea to them informally. One student even taught himself how to make a data display in Microsoft Excel instead of by hand as I had imagined:
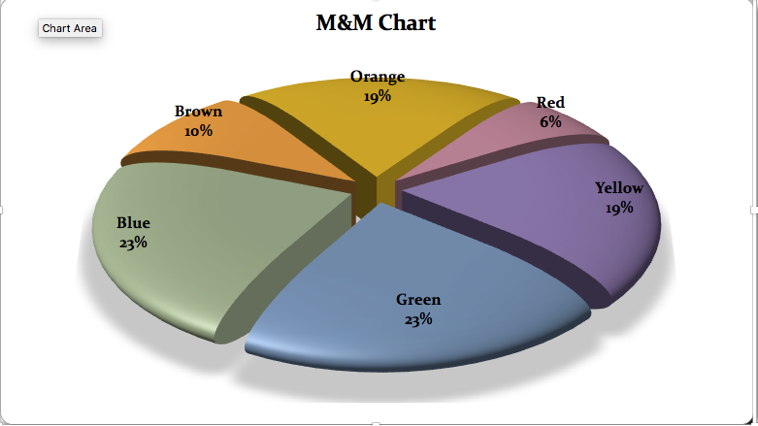
This graph also offered the opportunity to talk about an effective display that I wasn't anticipating. Why not make the colors of the pie chart match the colors referenced? That wasn't a part of the instructions but presented the student with a unique learning opportunity.
You might notice that both of those Badging opportunities originated from resources that I found through my PLN on Twitter. I only saw the Prime Number opportunity because Dr. Butler mentioned it and it came across my timeline. I only saw the M & M's opportunity because another math teacher, Bowman Dickson, mentioned it. I didn't have to go on a huge search for resources because they landed in my lap due to my strong PLN. If you choose to create your own Badging opportunities for your students, I can't recommend highly enough a strong, curated network of colleagues like I have with the members #MTBoS community on Twitter. Personally, I would love to connect with you on that platform if you're looking for a way to get started in the community!
Next time we will examine one final Badge strand and provide some wrap-up thoughts on this unique learning opportunity for Middle School students.
#MiddleSchool